Strategy Performance
Understanding how the NG Tactical Growth strategy has behaved across historical market environments.
The results below illustrate the historical simulated performance of the NG Tactical Growth strategy based on the rules that
underpin the portfolio system. These results are derived from historical market data and demonstrate how the strategy
would have responded across different market conditions.
Performance overview
The following data illustrates the historical performance characteristics of the NG Tactical Growth strategy across different
market environments. Results shown include historical back-tested performance prior to launch and are presented
alongside recognised market benchmarks for context.
Growth of investment
A 60/40 global equity and bond benchmark is included as a reference, representing a traditional balanced investment portfolio. The NG
Tactical Growth strategy is a dynamic multi-asset portfolio that allocates across equities, fixed income and other asset classes depending
on prevailing market conditions. As a result, the strategy’s asset allocation and risk profile may differ from a pure equity index over time.
growth of $10,000
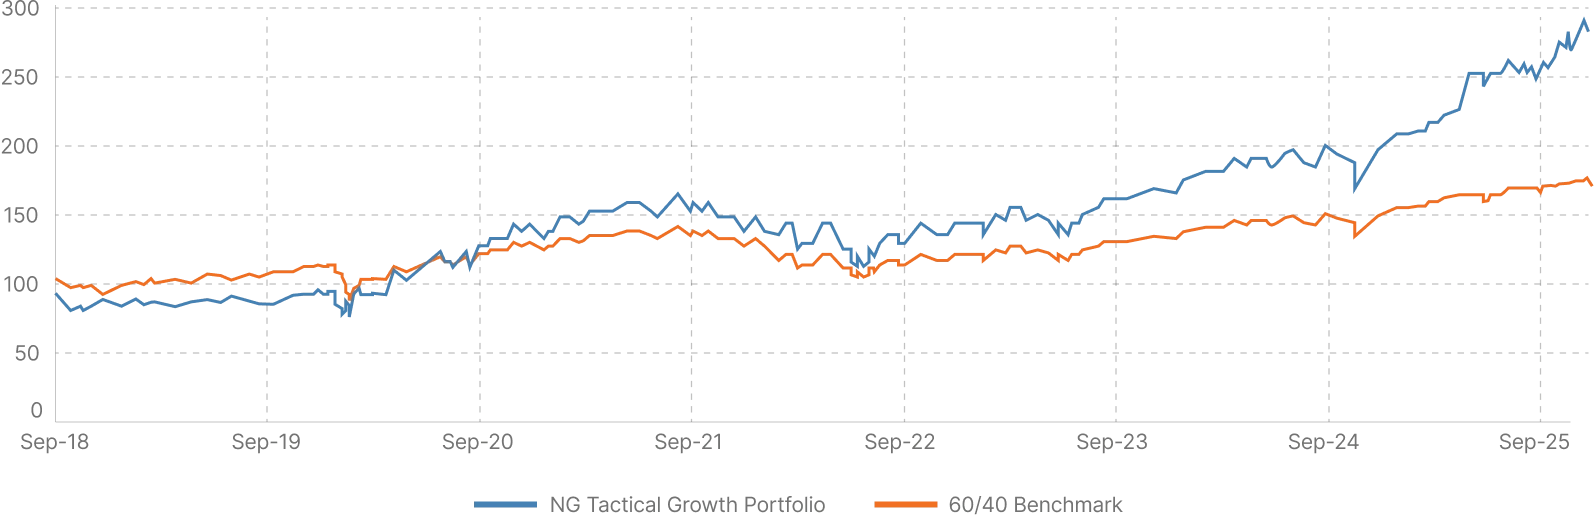
This chart illustrates the growth of a $10,000 investment in the NG Tactical Growth strategy compared with a traditional 60/40 global equity
bond benchmark. The lines represent the performance of NG Tactical Growth and the benchmark portfolio over the same period.
Benchmark context
A traditional 60/40 portfolio is used as the reference benchmark, comprising 60% MSCI World Index (representing global equities) and 40% Bloomberg Global Aggregate Bond Index (representing global fixed income). This benchmark reflects a conventional diversified investment approach.
The NG Tactical Growth strategy is a dynamic multi-asset portfolio that allocates across equities, fixed income and other asset classes
depending on prevailing market conditions. As a result, its asset allocation and risk profile may differ from those of static benchmark
portfolios over time.
Strategy approach
Traditional portfolios often rely on static asset allocations that remain largely unchanged through different market
environments. The NG Tactical Growth strategy uses a systematic framework to dynamically adjust exposure across
asset classes in response to changing market conditions.
The objective is to participate in long-term market growth while maintaining a disciplined approach to risk management.
Key strategy metrics
Summary statistics from the NG Tactical Growth historical backtest period.
13.63%
Annualised Return
-18.36%
Maximum Drawdown
13.06%
Volatility
1.06
Sharpe Ratio
158.01%
Total Return (Backtest Period)
2019 – 2026
Backtest Period
Calendar year performance
| Year | NG Tactical Growth | 60/40 Global Equity Bond Benchmark |
|---|---|---|
| 2026 | 9.66% (to end Feb) | 2.58% (to end Feb) |
| 2025 | 38.87% | 15.99% |
| 2024 | 29.31% | 10.45% |
| 2023 | 24.44% | 15.29% |
| 2022 | -12.84% | -18.25% |
| 2021 | 18.10% | 10.88% |
| 2020 | 36.11% | 12.92% |
| 2019 | 6.47% | 18.90% |
Monthly returns history
| YEAR | JAN | FEB | MAR | APR | MAY | JUN | JUL | AUG | SEP | OCT | NOV | DEC | TOTAL |
|---|---|---|---|---|---|---|---|---|---|---|---|---|---|
| 2019 | 0.84% | 0.41% | 0.39% | 0.76% | -5.66% | 4.20% | 1.36% | 0.33% | 0.09% | -0.72% | 0.41% | 4.22% | 6.47% |
| 2020 | 0.80% | -7.35% | -0.23% | 6.43% | 2.62% | 4.41% | 7.51% | 7.64% | -2.79% | -2.33% | 9.91% | 6.09% | 36.11% |
| 2021 | 1.58% | 0.65% | -0.79% | 3.14% | 1.26% | 3.34% | 1.05% | 2.64% | -4.50% | 5.18% | 0.16% | 3.38% | 18.10% |
| 2022 | -6.26% | -0.70% | 3.68% | -6.07% | 0.46% | -3.93% | 1.21% | -0.63% | -3.15% | 1.56% | 1.54% | -0.82% | -12.84% |
| 2023 | 2.15% | -4.96% | 5.21% | 0.76% | 1.59% | 4.30% | 3.18% | -1.75% | -3.86% | -3.73% | 7.88% | 5.42% | 16.36% |
| 2024 | 1.21% | 4.36% | 2.97% | -2.79% | 4.19% | 3.81% | 0.25% | 1.35% | 2.81% | -3.00% | 2.38% | -2.12% | 16.13% |
| 2025 | 4.34% | -3.19% | -2.56% | 2.56% | 4.14% | 4.79% | 2.09% | 3.57% | 6.09% | 3.11% | -1.39% | 2.13% | 28.32% |
| 2026 | 5.82% | 3.63% | 9.66% |
Performance shown for NG Tactical Growth represents historical back-tested results prior to launch and is provided for illustrative purposes only. Simulated performance has inherent limitations and does not represent actual trading. Past performance is not a reliable indicator of future results.
Important information
The performance shown above is based on simulated back testing and does not represent actual trading results. Back-tested performance is simulated and derived from applying the strategy model to historical market data. It is provided for illustrative purposes only and does not represent actual live trading. Actual investment results may differ once the strategy is implemented through the live NG Tactical Growth ETP.